


User’s Guide
National Institute of Environmental Health Sciences (NIEHS)
Contents
- Introduction
- Candidate gene SNP selection (GenePipe)
- GWAS functional SNP selection (GenomePipe)
- SNP selection in linkage loci (LinkagePipe)
- TAG SNP selection (TagSNP)
- Functional SNP prediction (FuncPred)
- SNP information in DNA sequence (SNPseq)
- Reference
- How to cite this work
- Update Information
Introduction
SNPinfo is designed to comprehensively utilize computational (predicted functional SNPs that have differential affect between reference allele and alternative allele), experimental and epidemiological information together with recent genome wide association study (GWAS) results and linkage disequilibrium (LD) information to prioritize SNPs for further genetic mapping studies. Users are not required to provide genotype information for LD calculation because genotype data have been pre-deposited into the web server database for all SNPs with population genotype data found in HapMap (3 populations) and dbSNP (5 populations).
The web utilities can be used for the following tasks:
- TAG SNP selection for candidate genes based on LD, GWAS results and SNP functional prediction information.
- TAG SNP selection for candidate genes based on LD, SNP functional prediction information.
- TAG SNP selection for candidate genes or candidate regions based on LD information only.
- Functional SNP selection from GWAS SNPs and SNPs in high LD with GWAS SNPs.
- GWAS SNP selection in candidate genomic regions, such as: linkage loci.
- Visualization of LD or genotype structure.
- Querying SNP functional predictions and minor allele frequencies.
- Visualization of SNP information in DNA sequence.
- Visualization of CpG region.
- Preparing DNA Sequence for Primer Design considering SNP information in flanking sequence.
GenePipe: Candidate gene SNP selection
This pipeline provides SNP prioritization for candidate genes and their flanking regions based on Genome wide association study (GWAS) results, functional SNP predictions and Linkage disequilibrium (LD). Publically avialable GWAS data can be downloaded from dbGaP or other locations. If GWAS data is not provided, this utility will select SNPs based on LD, or SNP functional prediction or both information.
Try example data
Elect to use the P value and gene list example files to learn how the web utility work. User can click and open the linked example file to check the format of input files. The example GWAS P value file was from an actual GWAS study using Illumina 550K genotyping chip, but the P values were randomly shuffled.
Upload GWAS P values
P value file follows a comma-delimited text format that contain the columns listed below.
SNP rsid,P-value
For example:
Upload gene list
Gene list file follows a comma-delimited text format that contain the columns of gene name and NCBI gene id. Gene id instead of gene name will be used for gene identifier. NCBI gene id can be easily obtained from NCBI Entrez Gene.
For example:

Genotype data
Options to use the combined ethnic-specific genotype data in dbSNP database or only HapMap genotype data for linkage disequilibrium (LD, measured by r2) calculation. dbSNP includs genotype data submitted by HapMap and many other submitters. Thus dbSNP not only has genotype data for many SNPs not in HapMap, but also has larger sample size for HapMap SNPs.
The current database has genotype data for samples from 5 population groups in dbSNP (we excluded other populations with very limited genotype data available in dbSNP) and 11 populations in HapMap. dbSNP samples may not as homogenous as HapMap because dbSNP includeds samples from multiple submitters. We combined genotypes in dbSNP database for individuals of same ethnic group together. If multiple submitters genotyped the same SNP in same individual, and the genotype data are inconsistent among them, we assign the individual the most commonly called genotype, or assign a missing if genotype calls are equally split.
The the number of SNPs with genotype data in dbSNP and HapMap database is shown in the following table
| Population | dbSNP | HapMap |
|---|---|---|
| Asian | 4,348,928 | - |
| European | 4,344,285 | - |
| Sub-Saharan African | 4,104,877 | - |
| African American | 1,712,302 | - |
| Hispanic | 30,471 | - |
| African ancestry in Southwest USA(ASW) | - | 1,561,453 |
| Utah residents with Northern and Western European ancestry from the CEPH collection(CEU) | 4,030,774 | 4,030,774 |
| Han Chinese in Beijing, China(CHB) | 4,052,336 | 4,052,336 |
| Chinese in Metropolitan Denver, Colorado(CHD) | - | 1,306,196 |
| Gujarati Indians in Houston, Texas(GIH) | - | 1,407,877 |
| Japanese in Tokyo, Japan(JPT) | 4,052,423 | 4,052,423 |
| Luhya in Webuye, Kenya(LWK) | - | 1,529,764 |
| Mexican ancestry in Los Angeles, California(MEX) | - | 1,410,265 |
| Maasai in Kinyawa, Kenya(MKK) | - | 1,537,638 |
| Toscans in Italy(TSI) | - | 1,419,921 |
| Yoruba in Ibadan, Nigeria(YRI) | 3,984,356 | 3,984,356 |
GWAS population
The ethnic population that genome wide association study involved. Only one population can be selected currently, we will extend it to multiple populations later.
Study population
The populations on which an investigator want to study. If multiple populations are selected, a single set of multi-population LD tag SNPs will be selected to cover LD structure in each of the populations.
5` gene upstream region (Base pair)
A positive integer number to indicate how many base pair of 5` gene upstream flanking region should be covered by SNPs selected.
3` gene upstream region (Base pair)
A positive integer number to indicate how many base pair of 3` gene downstream flanking region should be covered by SNPs selected.
Tagging proportion cutoff
In an initial gene selection screen we calculate the percentage (tagging proportion) of SNPs in and around a gene that are in high LD with any SNPs in the GWAS. The possible value of tagging proportion range from 0 to 1. This cutoff is to indicate good or bad coverage of common SNP (defined by the parameter value of "Minor Allele Frequency Cutoff for Common SNP") within a gene + flanking region by GWAS SNPs. The denominator of a tagging proportion is the number of common SNPs within gene+flanking region defined above. The numerator is the number of common SNPs (within gene+flangking region) that are in high LD (at a LD threshold as defined below) with GWAS SNPs within gene+flanking region + 250,000 base pair on both sides of the flanking regions. If tagging tagging proportion for a gene is higher than the cutoff and none of the SNPs in the gene+flanking region has significant P value (at a P value cutoff defined below), the gene will be excluded.
Minor Allele Frequency Cutoff for Common SNP
Range from 0 to 0.5. SNPs with minor allele frequency above this cutoff will be classified into common SNPs, rare SNPs otherwise. This cutoff will be used for gene selection only.
GWAS P Value cutoff
GWAS SNPs with P value higher than this cutoff will be classified as high P value GWAS SNPs, low P value GWAS SNPs otherwise. SNPs that are in high LD with high P value GWAS SNPs will not be considered in SNP selection because we assume they were checked by GWAS already with no evidence of association. This cutoff should not be too small, a SNP with P value close to 0.05 in one GWAS can be the most significant SNP in another GWAS, e.g. the P value for SNP rs10993994 is 0.042 in one GWAS on prostate cancer, while 7.31x10⁻¹³ in a follow up study.
LD Threshold
Two SNPs with LD ≥ the threshold will be considered as being in high LD, low LD otherwise. LD is measured by pairwise r2
minimum # of SNPs tagged by a tag SNP
For a SNP, the number of tagged SNPs is calculated as the number of SNPs that are in high LD (at a LD threshold) with the SNP multiplied by the weight (defined below by user) of the SNP. The number of tagged SNPs must be ≥ this parameter value to qualify as a tag SNPs. Setting the parameter value higher will result in smaller number of tag SNPs being selected for a gene to cover most SNPs in the gene. For example, if assign weight of 1 to any categories of SNPs, and 2 for this parameter (require each tag SNP can capture at least 2 SNPs). For most genes, the LD tag SNPs selected in this way are able to capture over 80% to 90% of SNPs within genes while the number of tag SNPs is only about half of the number of tag SNPs to capture 100% of SNPs. Using only multi-SNP tag SNPs is one way to optimize study power given a fixed number of SNPs genotyped (de Bakker, et al 2005). This parameter together with different weights for different category of SNPs allows flexibility in controling the use of SNP functional prediction information in the SNP selection process. However, for a small percentage of genes with "messy" LD structure (where the majority of SNPs tag only themselves, i.e. are in singleton LD bins), selected tag SNPs may only be able to capture a small percentage of common SNPs if a value of ≥ 2 is assigned to this parameter.
minimum # of Tag SNPs/Gene
If the number of SNPs in a gene qualified as tag SNPs based on the above criterion (the minimum # of SNPs tagged by a tag SNP) is smaller than this parameter value, more best available SNPs that capture most SNPs within the gene will be selected as tag SNPs. This parameter is to ensure that at least some tag SNPsare selected for each gene.
maximum # of Tag SNPs/Gene
Maximum number of Tag SNPs allowed to be selected for a gene. This is similar to select best N SNPs to optimize power when assign same weight to any SNPs (de Bakker, et al 2005). Without the restriction, a large percentage of SNPs may be selected for only a small percentage of large genes. Users can assign a large positive integer to this parameter if there is no limitation of genotyping resource, or if they want to select SNPs to capture 100% of common SNPs within any genes.
Minor Allele Frequency Cutoff and Weight
Different minor allele frequency (MAF) cutoffs and weights can be assigned to different categories of SNPs. SNPs with MAF lower than the corresponding MAF cutoff will not be considered in SNP selection. The algorithm will preferecially select high weight SNPs. If a SNP belongs to multiple categories, the maximum of possible weights (in these categories that the SNP belong to) will be applied to the SNP. Investigators may want to assign lower MAF cutoffs to predicted "high risk" SNPs because such SNPs tend to have lower MAF due to natural selection. If a user only want to select SNP from a specific category of SNPs, he/she can unelect "Include" for other category of SNPs. For example, if a user only selects nsSNP, and then only nsSNPs will be selected. User can also ignore functional SNP prediction results by assigning same MAF cutoffs and weights to any types of SNPs. These MAFs and weights together with "minimum # of SNPs tagged by a tag SNP" can flexibly control the use of SNP functional prediction information in SNP selection process. Weights act as multipliers of the actual number of SNPs tagged by any given SNP. For example, if there is a nsSNP that tags a total of 4 SNPs, and nsSNPs as a category having a weight of 3, then the weight-adjusted tagging capability of the SNP is 4X3=12.
When SNPs in different categories tagged the same number of other SNPs, users can assign a slightly higher weight to some categories of SNPs to break the tie. For example, if more prefer small P value SNPs, users can assign 3.1 to Low P value SNPs and 3 to other SNP categories.
See "Functional SNP Prediction" below for the following parameters.
nsSNP,Splicing,Stop Codon,SNPs3D,Polyphen,TFBS,miRNA,Conservation
Low P SNP
GWAS SNPs with P value ≤ the "GWAS P value cutoff" as defined above.
Submit
The selection process is computationally intensive, it can take more than 10 minutes depending on the number of interested genes submitted.
Please do not double click the submit button while you are waiting for the results.
OUTPUT
In the output, each gene name or SNP rs id is associated with a hyperlink to corresponding NCBI gene or SNP web page. In the functional prediction output, 1 denotes that a SNP occurs in a putative functional region and has differecial functional effect between SNP reference allele and alternative allele, 0 otherwise.
Users can also export query result into an Excel file.
GenomePipe: GWAS functional SNP selection
Genome wide SNP association studies (GWAS) on large samples provided population based evidence of the relationship between phenotypes and more than half millions of SNPs. In addition, GWAS SNPs tag, via LD, a much larger set of SNPs, although the set of SNPs tagged by any individual GWAS SNP depends on the ethnicity of the genotyped individual. This web utility is to select predicted functional SNPs from SNPs that are in high LD with low P value GWAS SNPs (or that are themselves a GWAS SNP).
Try example data
Elect to use the GWAS P value example file to learn how the web query work. User can also click and open the linked example file to check the format of input file.
Upload GWAS P values
See Candidate gene SNP selection for the file format.
Genotype data
GWAS population
Study population
See Candidate gene SNP selection for the related explanation.
Flanking region (Base pair)
A positive integer with range of [1, 250,000] to indicate the maximum distance on both sides of a SNP to check for SNPs that are in high LD with the SNP. This is also the maximum distance between 2 SNPs to check for LD relationship between them. Two SNPs are considered to be independent of each other if the distance between them is larger than this parameter value.
GWAS P Value Cutoff
SNPs with P value ≤ the cutoff will be classified as low P value SNPs, and high P value SNPs otherwise. Only SNPs that are in high LD with low P value GWAS SNPs will be considered in the SNP selection.
LD Threshold
Two SNPs with LD ≥ the threshold will be considered as in high LD, low LD otherwise. LD is measured by pairwise r2
Minor Allele Frequency Cutoff
Different minor allele frequency cutoffs can be assigned to different categories of SNPs.
Investigators may want to assign smaller MAF cutoffs for predicted high risk SNPs because high risk SNPs tend to have lower MAF due to natural selection. If a user only want to select SNP from a specific category of SNPs, he/she can unelect "Include" for other category of SNPs. For example, if only nsSNP is checked then only nsSNPs will be selected.
See "Functional SNP Prediction" for the following SNP functional prediction parameters.
nsSNP, Splice, Stop Codon, SNPs3D,Polyphen, TFBS, miRNA, Conservation
LinkagePipe: GWAS SNP Selection in Linkage Loci
This utility is to select top ranked (based on P value) non-redundant GWAS SNPs in linkage loci. Linkage loci discovered by linkage studies on large number of pedigrees are valuable indicators of possible candidate genomic regions that may contain causal genetic markers. GWAS studies usually have much denser SNP markers than linkage studies, and thus can provide finer genetic mapping in larger population samples for the linkage study findings. Within each linkage locus, we firstly identify all GWAS SNPs with P value less than a certain threshold and eliminate any redundant SNPs (based on pairwise LD), and then select a user-specified number of top SNPs based on P value rank.
Try example data
Click checkoff box to use the GWAS P value and linkage loci example file to learn how the web query works. User can also click and open the linked example file to check the format of input files.
Upload GWAS P values
See Candidate gene SNP selection for the file format.
Upload Linkage Loci Positions
Linkage loci file follows a comma-delimited text format that contain the columns listed below.
Chromosome,name of linkage locus,start position of a linkage locus,end position of a linkage locus
For example:
Genotype data
Study population
See Candidate gene SNP selection for the related explanation.
Minor Allele Frequency Cutoff for Common SNP
SNPs with MAF lower than this cutoff will be excluded from SNP selection.
Maximum # of SNPs/linkage locus
Maximum number of SNPs allowed to be selected for each linkage locus
GWAS P Value Cutoff
SNPs with P value ≤ the cutoff will be classified as low P value SNPs, and high P value SNPs otherwise. High P value SNPs will be excluded from SNP selection.
LD Threshold
LD threshold to declare two SNPs are in high LD or in low LD. This will be used to eliminate redundant SNPs. LD is measured by pairwise r2
TagSNP: TAG SNP Selection
This utility provides LD tag SNP selection and visualization for single or multiple populations. It uses a refined greedy algorithm originally implemented in software TAGster (Xu, Kaplan et al. 2007a) for LD tag SNP selection. LD is measured by r2 or composite linkage disequilibrium (CLD).
This utility can also be used to finalize the combined SNP list from various selections pipelines. Users can paste here all SNP rs # from different selection results and provide a list of mandatorily included or excluded SNPs. The utility will then eliminate redundant SNPs chromosome-wide based on LD relationship and eliminate SNPs with low SNP assay design scores (if provided by users). It can also organize all SNPs into chromosome groups and produce high quality LD structure or genotype figures.
Query By
Query type can be gene name, NCBI gene id, SNP rs number or chromosome positions.
If query by gene name or gene id, the user has options to specify the length of 5` or 3` flanking gene region.
If query by SNP rs number, the utility will firstly separate SNPs into chromosome group, and then select LD tag SNPs for SNPs within each chromosome group. Users must also paste in the set of rs numbers for all SNPs for which they wish to mandate inclusion.
Genotype Data
Population
See Candidate gene SNP selection for the related explanation.
Force in SNPs
A list of mandatorily included tag SNP rs number with file format of single column of rs id.
For example:

In the selection process, the algorithm will first select SNPs in this file as LD tag SNPs, and then select additional tag SNPs for other un-tagged SNPs.
However, if a SNP in this file is not actually included in the query SNP rs list (or is not located within the query gene and flanking region, or is not in the query chromosome position range,or do not have genotype data in user specified database(dbSNP or HapMap)), the algorithm will exclude the SNP from further selection process, and thus will not be selected as a tag SNP. This restriction is to rule out some possible typing error. User can simply add them back as tag SNPs if there is no error.
Force out SNPs
A list of SNP rs number that should not be selected as tag SNP.
Although SNPs in this file will not be selected as tag SNPs, their information will be used in the selection process. They can be tagged by other tag SNPs unless they are singletons (only can be tagged by themselves). For example, if there are 2 other SNPs A and B, SNP A can capture SNP C and D, D is in force out SNP list, if SNP B can only tag SNP C but not D, and then SNP A will be firstly selected as tag SNP because it can capture more other SNPs.
SNP Design Score
Scores within the range of [0,1] to indicate the probability of a SNP to be successfully genotyped on a specific genotyping platform.
SNP assay design score file follows a comma-delimited text format that contain the columns listed below.
SNP rs id,score
For example:

SNP Design Score cutoff
SNPs with assay design score lower than this cutoff will not be selected as tag SNP.
LD Method
Specify a statistic used to measure LD relationship between SNPs. CLD: composite linkage disequilibrium.
Minimum # of valid genotype pairs required to calculate LD
A minimum number of informative genotype pairs (genotype pairs without missing data) required between 2 SNPs to calculate a valid LD value between them. If the number of informative genotype pairs is less than the specified value, a missing LD value will be assigned. LD statistic calculated based on very few genotype pairs is not reliable.
LD threshold
LD threshold to declare two SNPs are in high LD or in low LD. This is used to decide whether one SNP can capture another SNP.
Maximum distance (bp) between SNPs for calculation of LD
Maximum physical distance in base pair between two SNPs allowed for calculation of LD between the two SNPs. A missing value will be assigned if their physical distance is more than the distance specified here to assume independence between them.
To speed up the selection procedure, when the distance was set to less than or equal to 250,000 bp, the server will use pre-deposited LD values (r squares precalculated based on dbSNP genotype data or downloaded from HapMap web site (www.hapmap.org)). When the distance was set to a value of greater than 250,000 bp, the server will calculate LD based on the genotypes user specified.
Minor Allele Frequency range
SNPs with minor allele frequency outside of the range will be excluded in SNP selection. This allow user to select tag SNPs for SNPs within any frequencies range within [0,0.5].
Minimum number of SNPs tagged by each tag SNP
This defines the minimum number of SNPs required to be tagged by each tag SNP across single or multiple populations; The parameter value will substantially influence the number of tag SNPs as well as the percentage of SNPs captured by selected tag SNPs. For example, if a parameter value of 2 is assigned to exclude singleton tag SNPs (tag SNPs that only tag themselves in a single population during the selection process), the number of tag SNPs will be reduced by half for most genes while tagging proportions (the percentage of common SNPs captured by selected tag SNPs) will decrease by only around 10% (Xu, Kaplan, Taylor 2007b). However, for genes with messy LD structure (majority of SNPs only be able to tag themselves), selected tag SNPs may only capture a very small percentage of common SNPs if a value of ≥ 2 is assigned to this parameter.
Figure
If query by rs number, each LD or genotype figure will be produced for each chromosome for each population.
If query by gene name or gene id, each LD or genotype figure will be produced for each gene for each population.
Sort by
LD or genotype figures can be sorted by
LD similarity: sort by LD bins, from large to small LD bins if no force in SNPs.
Genotype similarity: sort by genotype similarity (3 possible genotypes for each SNP: homozygous common, heterozygous and homozygous rare), genotype figure usually looks more clean with this option.
Chromosome position: sort by SNP chromosome position.
Show LD Bins
Show track for LD bins and the average LD statistic across SNPs within each LD bin on the top of LD or genotype figure.
Show minor allele frequency track
Show minor allele frequency for each SNP on the top of LD or genotype figure.
Show chromosome position track
Show chromosome position track at left of LD figure.
Flag nsSNPs
Flag non-synonymous SNPs with star symbol on the top of LD or genotype figure.
Color SNPs with Genomic Context
See Output for the related explanation.
Output
LD tag SNP file
The format of the file can be found below. The first line contains a list of variable names.
gene_name tag_SNP_identifier Size(number of SNPs captured by tagSNP) Average_MAF Average r^2 <pop_1> captured SNP list in population 1 <pop_n> captured SNP list in population n
For example:
LD Figure
Each figure displays the following contents:
- SNP name colored with genomic context
- Black: Intron region
- Red: Coding region
- Orange: Splice site
- Blue: UTR region
- Green: Non-genic region
- Flags for tag SNPs and non-synonymous SNPs
- Minor allele frequency for each SNP each population denoted by the height of green bar.
- Pair-wise LD values indicated by different color
- Chromosome locations for tag SNPs (red) and other SNPs (blue)
- Total chromosome length that SNPs cover
- gene name and gene id
For example:
LD figure for SNPs within gene ABP1 (gene id: 26) and 1000 bp flanking region on both sides, sorted by LD group
Click for larger view
It can also be sorted by SNP chromosome position (the following example) or genotype similarity.
LD figure for SNPs within gene ABP1 (gene id: 26) and 1000 bp flanking region on both sides, sorted by chromosome position
Click for larger view
Genotype Figure
Genotype figure displays the following contents from up to bottom:
- SNP list
- Flags for tag SNPs and non-synonymous SNPs.
- LD bins and average r2 denoted by the height of red bars within each LD bin. For each LD bin, r2 is averaged across r2s between a LD tag SNP and other SNPs within the LD bin. Values of r2 range from 0 to 1.
- Minor allele frequency for each SNP each population denoted by the height of red bars.
- Sorted genotypes with rows referring to individuals and columns referring to SNPs.
- major/minor alleles
For example:
SNPseq: SNP Information in DNA Sequence
This tool displays SNP related information on the context of NCBI DNA reference sequence. It is also a tool to prepare DNA sequence for PCR primer design based on SNP information and visualization of CpG regions.
Query type
Query type can be gene name, NCBI gene id, SNP rs number or chromosome position.
DNA sequence is for NCBI Build Number: 36 Version: 2.
Info
Options to display SNP related information in the output.
There are the following options:
- Base pair substitution: SNP alleles
- Major Allele Frequency: investigators may more interested in major allele frequency than minor allele frequency in primer design
- rs number: SNP rs id
- Validation: SNP validation status. Refer to dbSNP for more explanation
- Genomic Context: where a SNP is located, e.g. intron, exon
Output
Clean Sequence
SNP information will show up when mouse over a SNP.
For example:
Click for larger view
Clean Sequence and Color CpG
Output is similar with "Clean sequence" except that CpG region will be colored as light blue.
Embed Info in Sequence
SNP information will be embedded into DNA sequence in the format of:
allele in reference sequence: possible allele type|major allele:Major Allele Frequency|rs number|Validation|Genomic context
For example:
Click for larger view
Prepare Sequence for Primer Design
SNP information will be embedded into DNA sequence, 6 output options will be provided for each SNP. User can based on the major allele frequency or other information for a SNP to decide whether to ignore the SNP. After select a output format for each SNP, click "clean sequence" and then DNA sequence will be ready for use with primer design software.
For example:
Click for larger view
FuncPred: Functional SNP Prediction
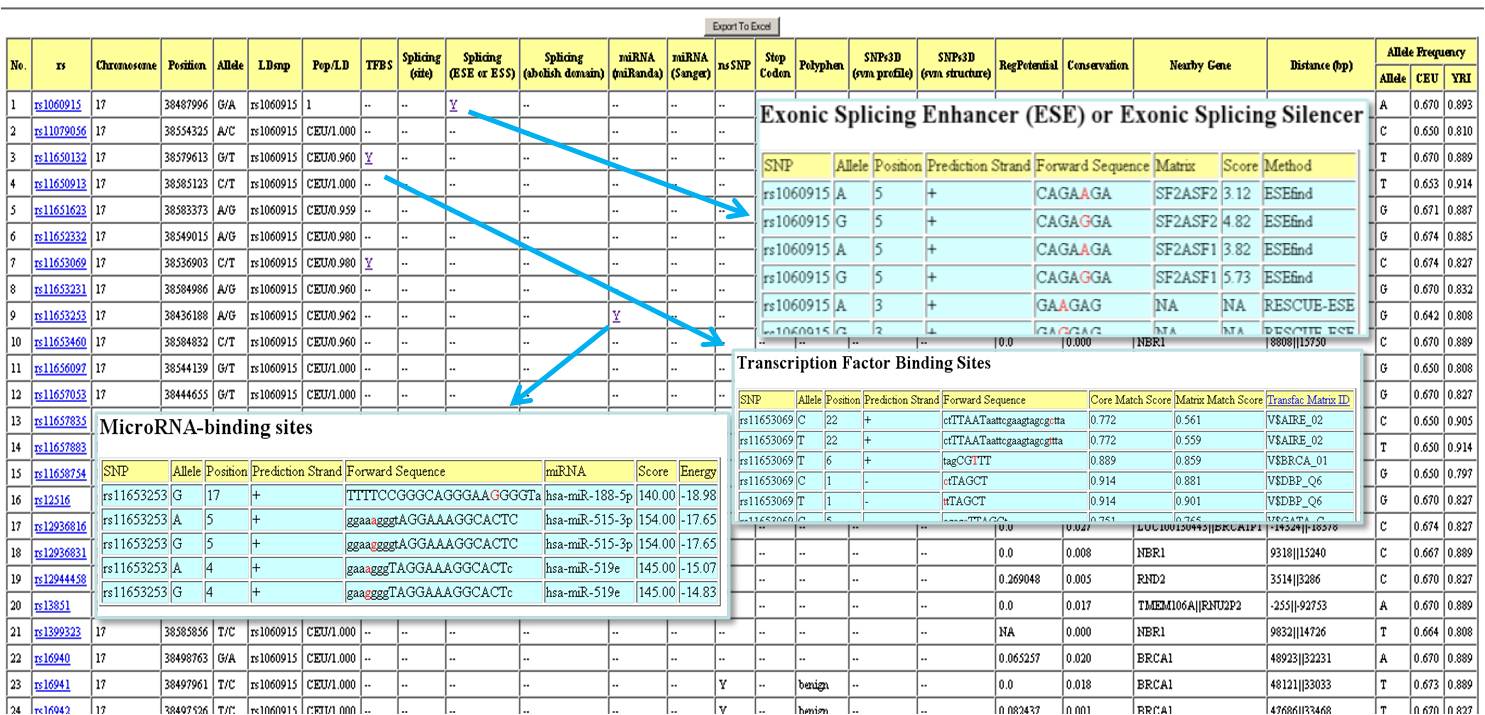
SNPs may have functional effects including: transcriptional regulation by affecting transcription factor binding sites (TFBS) activity; premature termination of amino-acid sequence (stop codons); changing of splicing pattern or efficiency by disrupting splice site, exonic splicing enhancers (ESE) or silencers (ESS); alteration of protein structures or properties by changing single amino acids or changing the frame of the protein-coding region; regulation of protein translation by affecting microRNA (miRNA) binding sites activity. Many software tools or web servers can be used to predict TFBSs, ESE site, ESS site or miRNA binding sites. However, although SNPs may be located in such binding sites, the alternative alleles of a SNP may not necesarily have different activities. We designed several pipelines to predict SNPs that may affect biological function with alternative alleles.
Include SNPs with LD> ... in population
Display SNPs that are in high LD (in population selected) with SNPs in the query SNP list.
nsSNP
SNPs in protein-coding regions that can cause amino acid change (non-synonymous coding SNPs, nsSNP).
Stop Codon
SNPs that may lead to premature termination of peptides (non-sense), which would disable the protein function.
Polyphen prediction
Polyphen (http://genetics.bwh.harvard.edu/pph/) (Sunyaev, Ramensky et al. 2001) method predicted damaging nsSNPs.
SNPs3D prediction
SNPs3D (http://www.snps3d.org/) (Yue, Melamud et al. 2006) method predicted damaging nsSNPs.
TFBS Prediction
If a non-coding SNP is located at a transcription factor-binding site (TFBS) of a gene, then it may affect the level, location, or timing of gene expression. We predicted such SNPs according to the procedure described in Xu and Taylor (submitted).
Refine TFBS
Several studies (Elnitski et al 2003,2006; King et al, 2005) show that using both the predicted conserved TFBS together with the regulatory potential score(RP Score) (downloaded from UCSC genome bioinformatics web site(http://genome.ucsc.edu)) can result in more precise predictions, so we also provide this option on the web server.
Splicing regulation
SNPs that are located at 2 base pair of intron-exon junction region, exonic splicing enhancer (ESE), or exonic splicing silencer (ESS) may disrupt splicing activity and cause alternative splicing. We predict SNPs whose alternative alleles may affect splicing using the methods detailed in Xu and Taylor (submitted).
miRNA Binding Site Prediction
microRNAs (miRNA) are single-stranded RNA molecules of about 21-23 nucleotides in length, which can inhibit protein translation through binding to the end of a messenger RNA (mRNAs). We predicted SNPs that may affact miRNA binding site activity according to the methods described in Xu and Taylor (submitted).
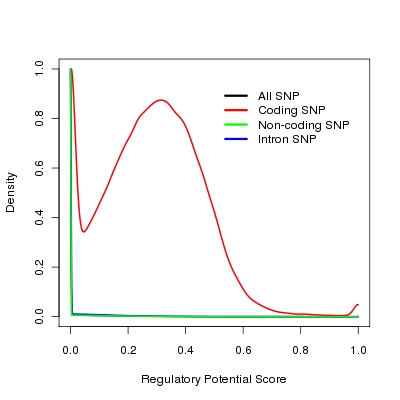
Regulatory Potential Score
Regulatory potential score (ESPERR Regulatory Potential (7 Species)) downloaded from UCSC genome bioinformatics web site (http://genome.ucsc.edu/). Because SNPs in coding region are tend to have higher regulatory potential scores (see Figure, lines for all SNPs in human genome, non-coding SNPs and intron SNPs are overlapped), So we use this score only for SNPs that are outside of coding region in SNP selection.
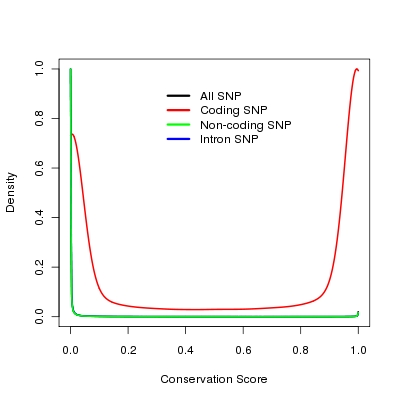
Conservation Score
ertebrate Multiz Alignment and Conservation score(17 Species) downloaded from UCSC genome bioinformatics web site (http://genome.ucsc.edu/). Because SNPs in coding region are tend to have higher conservation score (see Figure, lines for all SNPs in human genome, non-coding SNPs and intron snps are overlpped), so we use this score only for SNPs that are outside of the coding region of genes in SNP selection.
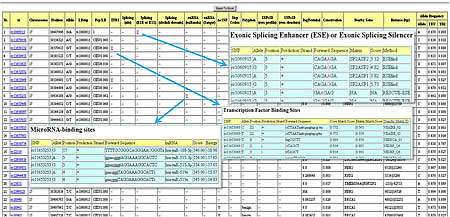
Output
LDsnp: SNP that is in high LD with the SNP in the "rs" column.
Pop/LD: population group/LD value between 2 SNPs mentioned above.
Splicing(site): within 2 base pair of intron/exon junction region.
click "Y" to display the detailed prediction information.
References
- Elnitski, L., Hardison, R.C., Li, J., Yang, S., Kolbe, D., Eswara, P., O'Connor, M.J., Schwartz, S., Miller, W. and Chiaromonte, F. (2003) Distinguishing regulatory DNA from neutral sites. Genome Research, 13, 64-72.
- King, D.C., Taylor, J., Elnitski, L., Chiaromonte, F., Miller, W. and Hardison, R.C. (2005) Evaluation of regulatory potential and conservation scores for detecting cis-regulatory modules in aligned mammalian genome sequences. Genome Research, 15, 1051-1060.
- Elnitski, L., Jin, V.X., Farnham, P.J. and Jones, S.J. (2006) Locating mammalian transcription factor binding sites: a survey of computational and experimental techniques. Genome Research, 16, 1455-1464.
- Artegni, L., J. Wang, et al. (2003). "ESEfinder: A web resource to identify exonic splicing enhancers." Nucleic Acids Research 31(13): 3568-71.
- de Bakker, P.I., Yelensky, R., Pe'er, I., Gabriel, S.B., Daly, M.J. and Altshuler, D. (2005) Efficiency and power in genetic association studies.[see comment]. Nature Genetics, 37, 1217-1223.
- Sunyaev, S., V. Ramensky, et al. (2001). "Prediction of deleterious human alleles." Human Molecular Genetics 10(6): 591-7.
- Yue, P., E. Melamud, et al. (2006). "SNPs3D: candidate gene and SNP selection for association studies." BMC Bioinformatics 7: 166.
- Xu, Z., N. L. Kaplan, J.A. Taylor. (2007a). "TAGster: efficient selection of LD tag SNPs in single or multiple populations." Bioinformatics 23(23): 3254-5.
- Xu, Z., N. L. Kaplan, J.A. Taylor. (2007b). "Tag SNP selection for candidate gene association studies using HapMap and gene resequencing data." Eur J Hum Genet 15(10):1063-70.
- Fairbrother, W. G., D. Holste, et al. (2004). "Single nucleotide polymorphism-based validation of exonic splicing enhancers." Plos Biology 2(9): E268.
- Fairbrother, W. G., G. W. Yeo, et al. (2004). "RESCUE-ESE identifies candidate exonic splicing enhancers in vertebrate exons." Nucleic Acids Research 32(Web Server issue): W187-90.
- Finn, R. D., J. Mistry, et al. (2006). "Pfam: clans, web tools and services." Nucleic Acids Research 34(Database issue): D247-51.
- Graveley, B. R., K. J. Hertel, et al. (1998). "A systematic analysis of the factors that determine the strength of pre-mRNA splicing enhancers." EMBO Journal 17(22): 6747-56.
- Griffiths-Jones, S., H. K. Saini, et al. (2008). "miRBase: tools for microRNA genomics." Nucleic Acids Research 36(Database issue): D154-8.
- John, B., A. J. Enright, et al. (2004). "Human MicroRNA targets.[erratum appears in PLoS Biol. 2005 Jul;3(7):e264]." Plos Biology 2(11): e363.
- Kel, A. E., E. Gossling, et al. (2003). "MATCH: A tool for searching transcription factor binding sites in DNA sequences." Nucleic Acids Research 31(13): 3576-9.
- King, D. C., J. Taylor, et al. (2005). "Evaluation of regulatory potential and conservation scores for detecting cis-regulatory modules in aligned mammalian genome sequences." Genome Research 15(8): 1051-60.
- Matys, V., O. V. Kel-Margoulis, et al. (2006). "TRANSFAC and its module TRANSCompel: transcriptional gene regulation in eukaryotes." Nucleic Acids Research 34(Database issue): D108-10.
- Murzin, A. G., S. E. Brenner, et al. (1995). "SCOP: a structural classification of proteins database for the investigation of sequences and structures." Journal of Molecular Biology 247(4): 536-40.
- Wang, Z., M. E. Rolish, et al. (2004). "Systematic identification and analysis of exonic splicing silencers.[see comment]." Cell 119(6): 831-45.
- Xiao, X., Z. Wang, et al. (2007). "Coevolutionary networks of splicing cis-regulatory elements." Proceedings of the National Academy of Sciences of the United States of America 104(47): 18583-8.
How to cite this work
Zongli Xu, Jack A. Taylor (2009). SNPinfo: Integrating GWAS and Candidate Gene Information into Functional SNP Selection for Genetic Association Studies. Nucleic Acids Research.
Update Information
04/12/2009: HapMap genotype data for 11 populations in Phase III were added.
06/03/2009: FuncPred: changed "Minor Allele Frequency" to "Allele Frequency" so the frequencies are comparable across populations.
06/10/2009: FuncPred: added option to output functional prediction results for SNPs that are in high LD with query SNPs.
06/12/2009: FuncPred: added option to upload query list (snp rsid, gene name or gene id) file.
06/30/2009: FuncPred: incorporated detailed functional prediction information (for all SNPs with positive prediction results and no conservation filter).
Questions or suggestions can be addressed to webmaster